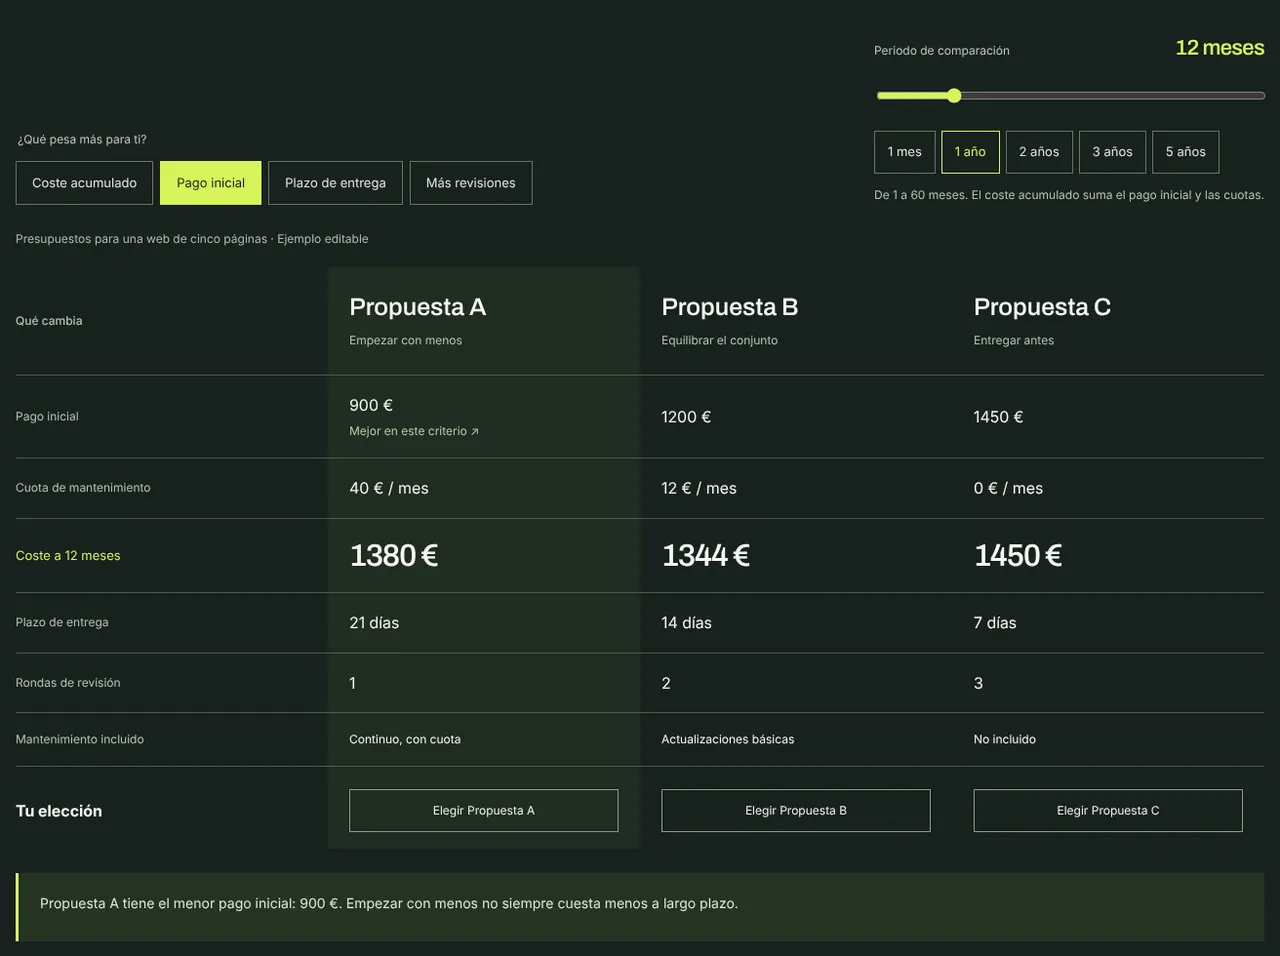
The person chooses the criterion
Accumulated cost, upfront payment, lead time or more revisions. When the criterion changes, the highlighted quote and the sentence explaining it change too.
Independent concept · B2B, comparison
Quotes that cannot be compared at a glance: one asks less upfront, one delivers sooner, one has no fee. CIFRA lets you choose the criterion and the horizon, and shows when the cheapest option changes.
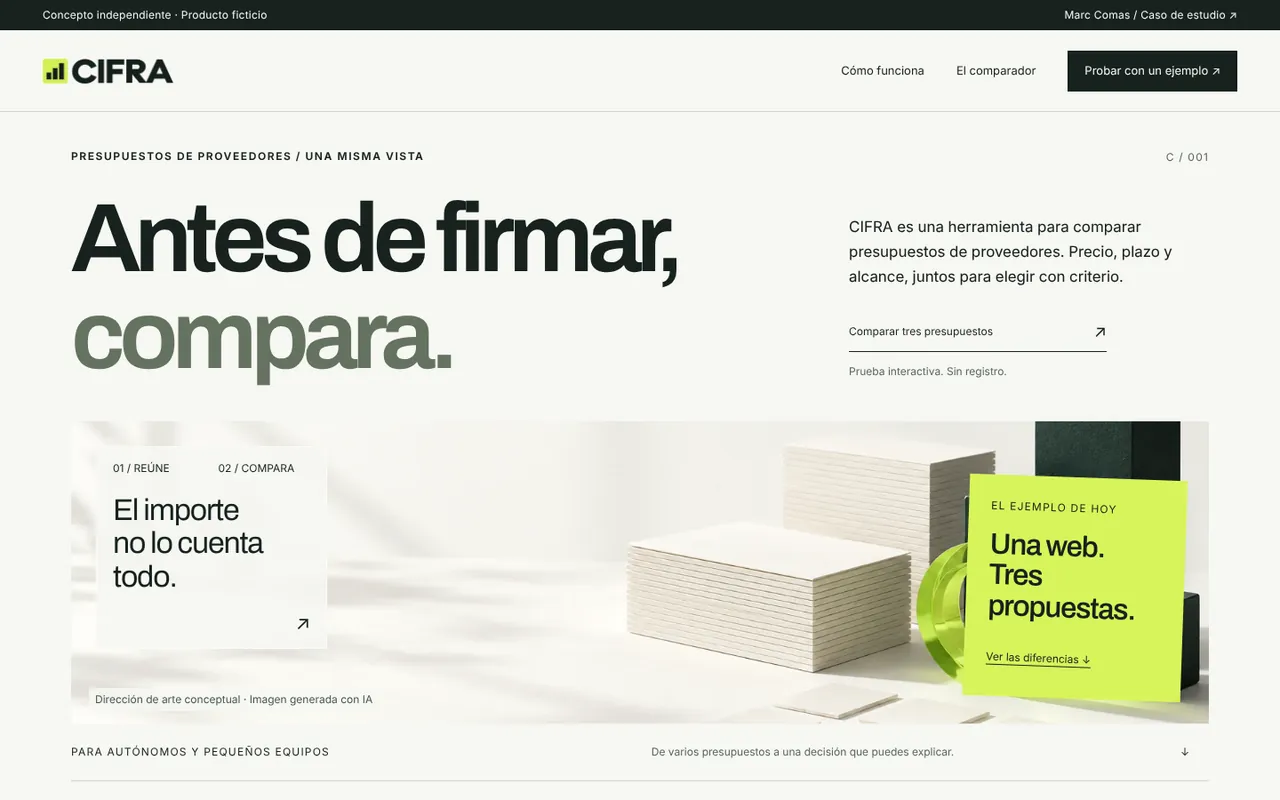

The challenge
A small company receives several quotes for the same job. Each combines upfront payment, monthly fee and lead time differently, and the cheapest on day one is not always the cheapest after a year.
The design question: how do you show the comparison without imposing what matters most, and without implying the tool decides for the person?
Design decisions
Each one can be checked in the demo.
Accumulated cost, upfront payment, lead time or more revisions. When the criterion changes, the highlighted quote and the sentence explaining it change too.
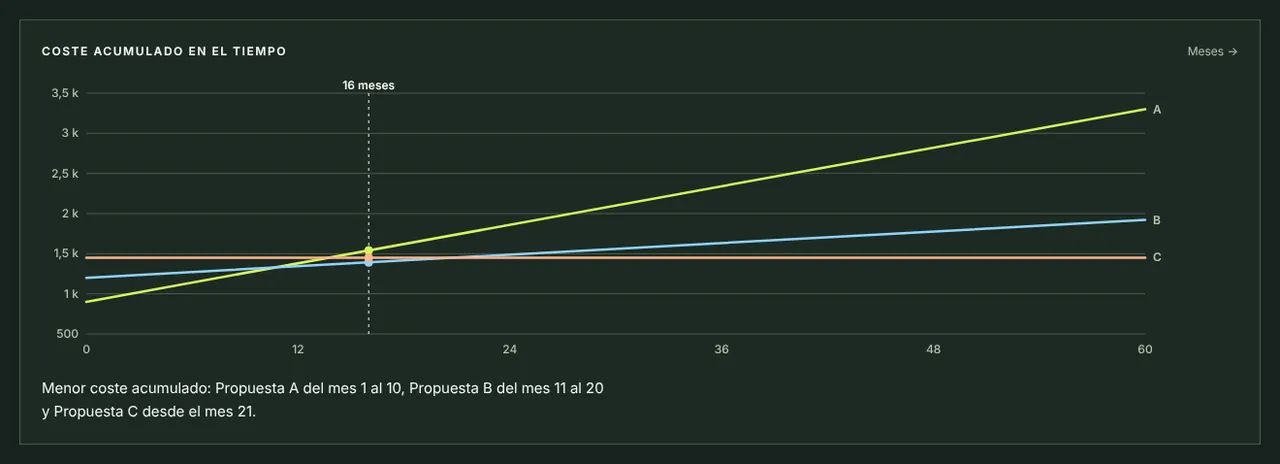
The horizon runs from 1 to 60 months and a chart plots each quote’s accumulated cost. Below it, in words: A is cheapest up to month 10, B from 11 to 20 and C from 21 on.
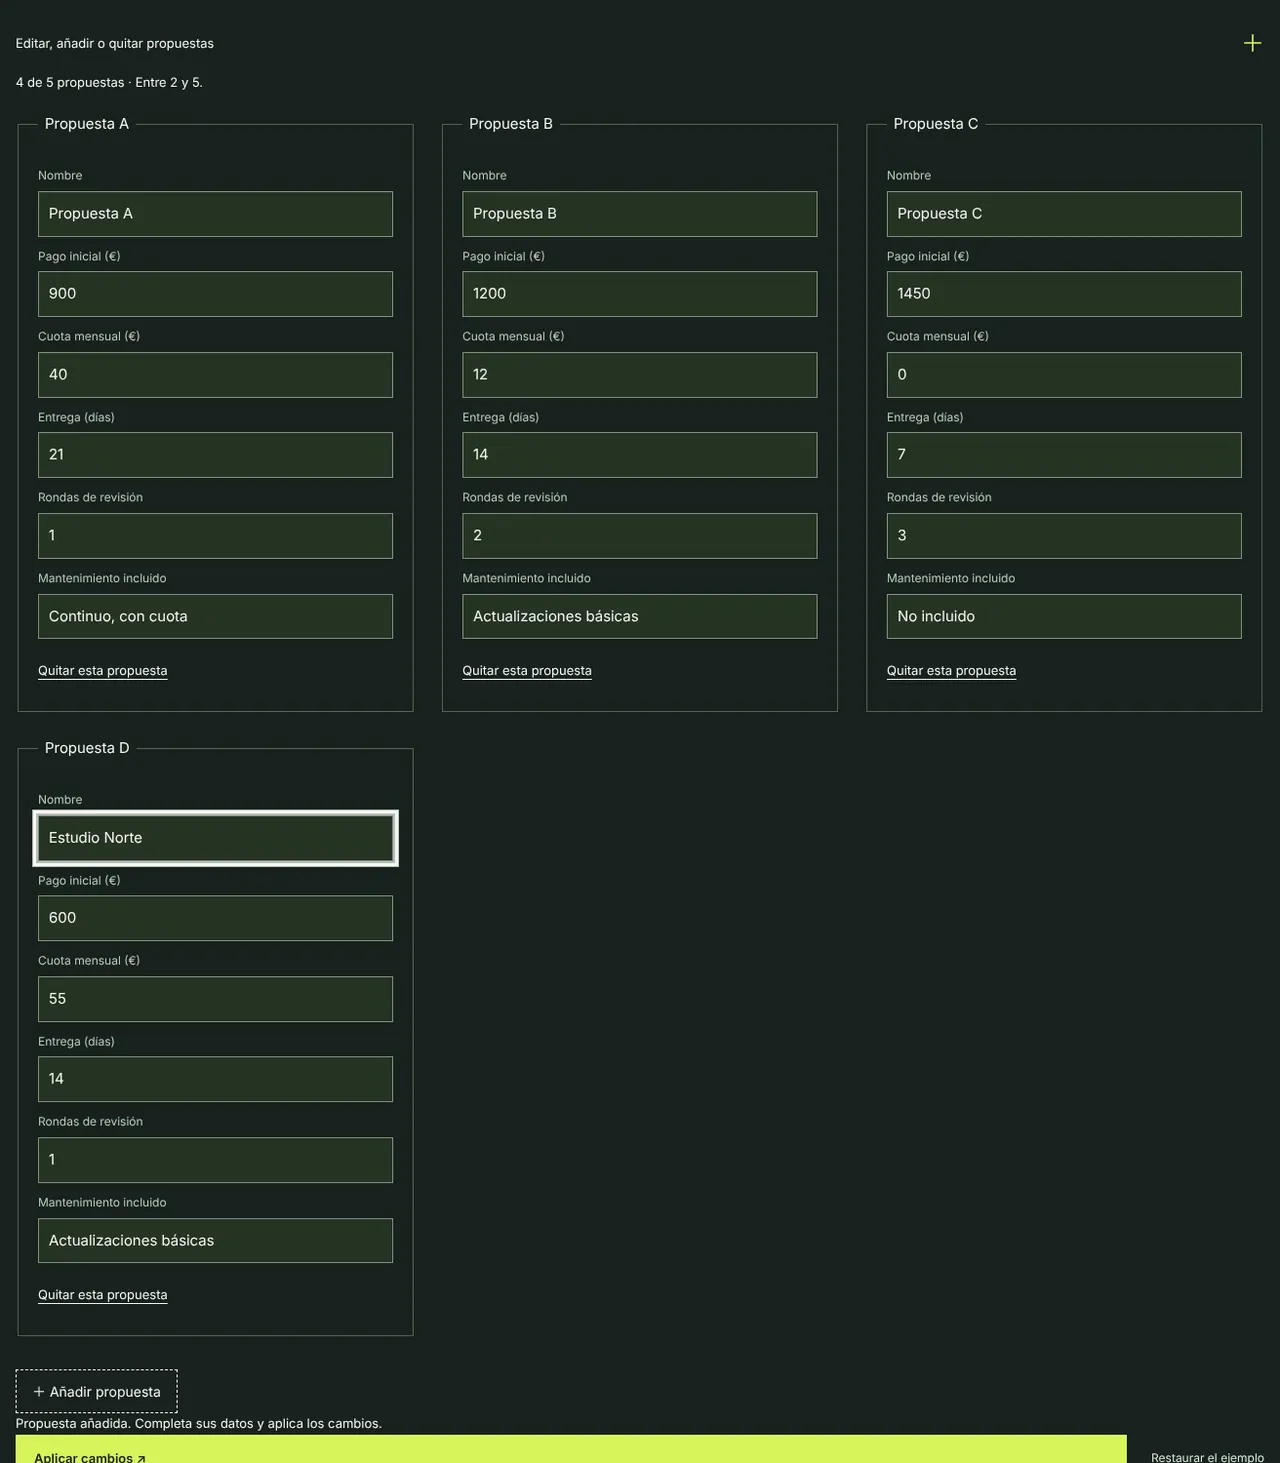
Quotes can be named, added and removed, from two to five, with clear limits and errors that say what to fix. The comparison is saved in the browser and in a shareable link.
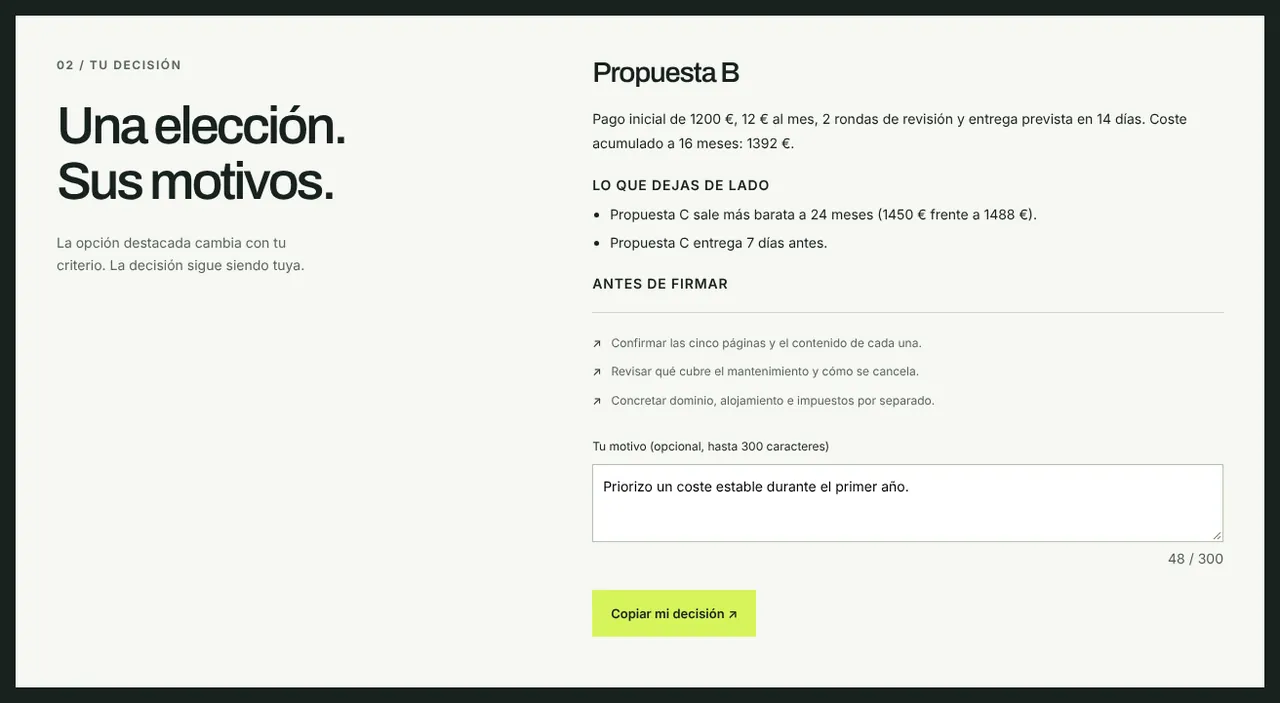
Choosing a quote opens a summary with what you give up (for example, that another is cheaper at 24 months), questions before signing, an optional note and “Copy my decision”.
What you can try
To see the decisions at work, in this order.
Move the horizon from 12 to 24 months and watch the cheapest one change.
Add a fourth quote with your own amounts.
Choose a quote and read what you give up.
Copy the link and open it in another tab.
Behind the interface
The calculation lives in quote-model.js, apart from the interface, including the month ranges in which each quote is cheapest. Upfront 0 to €1,000,000, fee 0 to €10,000, lead time 1 to 365 days.
With more time
These are hypotheses for a test I have not run yet, not results.
I can walk you through how I reached each decision in this concept.